General
In order to help follow up on document distributions to customers and suppliers, to enable project managers to monitor document development and to keep track of internal as well as external communication, PIRS offers its users the document controlling features. Please be aware that PIRS collects the information analyzed and displayed within the controlling views out of the content tabs of the PIRS documents and their linked correspondence. Therefore it is recommended to maintain all document information as completely as possible.
PIRS Controlling features enable you to easily answer following question:
-
Did we submit all required documents to the customer?
-
Did we/our customers or suppliers submit the documents on time?
-
Did the customer reply to my documents ?
-
What documents did we submit in a specific time frame?
-
What documents do we have to submit in future?
-
….
The Controlling View Layout
You will find a separate navigation area listing five standard controlling views within the PIRS navigator.
Each view is divided into three sections.
While a grid in the bottom part of the view will display all document and correspondence files matching the respective controlling view configurations, the upper part of the view graphically illustrates the data listed in the grid as a pie chart as well as a bar chart.
The charts will be updated automatically according to regular intervals but they can also be updated manually by clicking the refresh button visible in the right upper corner of each chart (  ).
).
As already explained in previous chapters, you are also able to alter the grid content by either using the search feature (  ) or by adding different filters (
  ).
).
In addition you can modify the presented content by adjusting the displayed columns. (For further information on customizing and adjusting grid content and setting filters, please refer to the chapters Customize a grid and Search and filter functions.)
For your information shell be noted that the configurations of the charts in the various controlling views can also be customized to fit you specific needs. If this should be the case, please contact your PIRS administrator and inform him/her about your requirements.
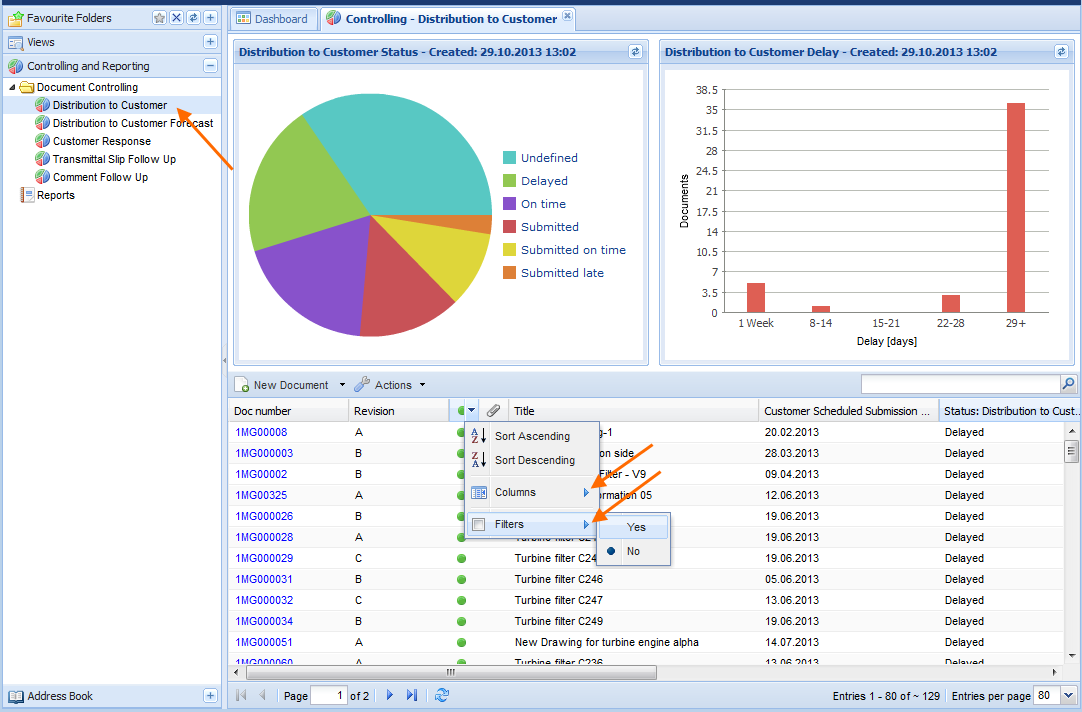
Distribution to Customer
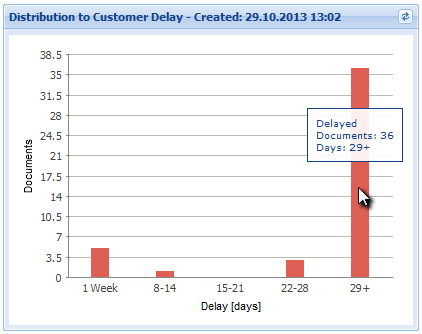
The first controlling view called "Distribution to Customer" will show you if you submitted all required documents to your customers. While the pie chart will enable you to see at one glance the number of documents according to their customer status, the bar chart displays the number of documents in a current delay range.
As exemplary illustrated in the following screenshots, the number of documents within each customer status will appear on each pie section as soon as you hover the cursor over it. In this case 5 documents are currently in the customer status "delayed". The second chart enables you to gather more detailed information about the time frame of the delayed documents. The x-axis displays the time frame while the y-axis indicates the number of documents. To show the exact number of delayed documents within a time period again, hover your cursor over the respective bar.
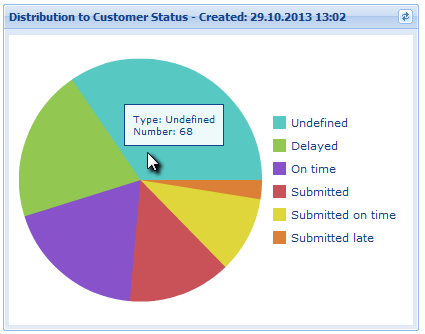
| Status | Description |
|---|---|
Delayed |
The scheduled delivery date has passed & no transmittal to the customer has been performed out of PIRS |
Submitted on time |
The scheduled delivery date equals the transmittal to customer sending date |
Submitted |
The scheduled delivery date is not defined but a transmittal to customer exists |
On time |
The scheduled delivery date is still in the future, but no transmittal to customer has been performed out of PIRS |
Submitted late |
The document was transmitted to the customer passed the scheduled delivery date |
Undefined |
The scheduled delivery date is not defined yet |
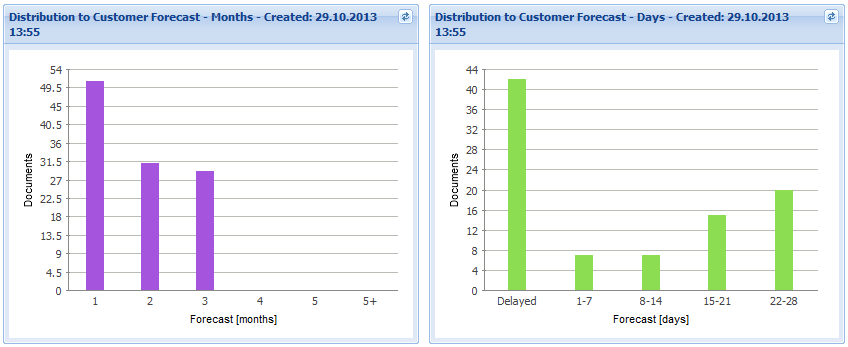
Distribution to Customer Forecast
The second controlling view will help you to keep track of the documents that have to be submitted in the near as well as far future.
The content grid below lists all documents where the scheduled transmittal date lies in the future, regardless if the documents have already been transmitted or not.
The two bar charts displayed in the upper part of the view will show the number of documents that will need to be submitted according to the schedules submission month or according to a certain frame of days.
The x-axis displays the number of months within which the documents will have to be submitted respectively the number of days or the time frame within which the documents will need to be send to the customer. The y-axis indicates the number of documents to be distributed within each time limit.
Customer Response
The third controlling view offers a review of all collected customer responses.
Please keep in mind that in order to ensure a complete representation of all correspondence, all relevant emails sent to private company mailboxes as well as paper correspondence sent via postal services need to be filed and stored within PIRS.
Again the content grid will display all documents were a customer response e.g. a comment or an approval notification has been filed.
While the first chart will provide you with an overview of the number of documents per customer illustrated as a pie chart, the second chart offers you a representation of the number of documents where the customer has failed to respond on time and for how long his response has been expected. Similar to the charts in the controlling view described above, the exact number of documents will be revealed as soon as you move the cursor over the respective pie piece or bar. The number of documents that have not been responded to by the customer, is represented by the y-axis and the time period is listed along the x-axis.
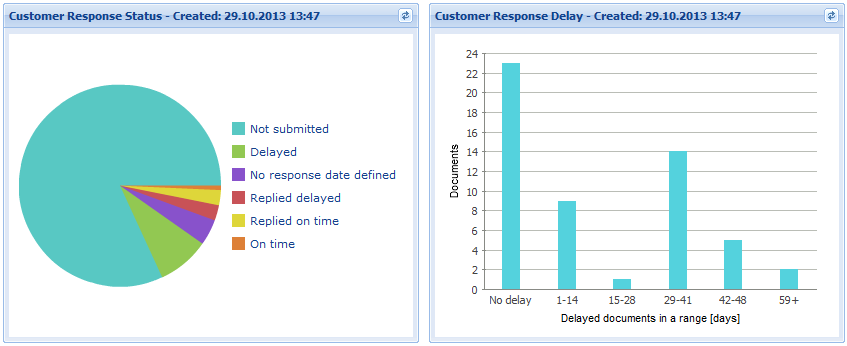
The following table displays a short descriptions for the different possible response statuses.
| Status | Description |
|---|---|
Not submitted |
No transmittal slip to customer exists within PIRS |
Delayed |
Required response date has passed and no customer comment is available |
No response date defined |
A transmittal to Customer exists but no required response date is defined for the document |
On time |
Required response date is today or in the future and no customer comment is available |
Replied delayed |
Required response date predates the submission date of the customer comment |
Replied on time |
Required response date equal or lies after the submission date of the customer comment |
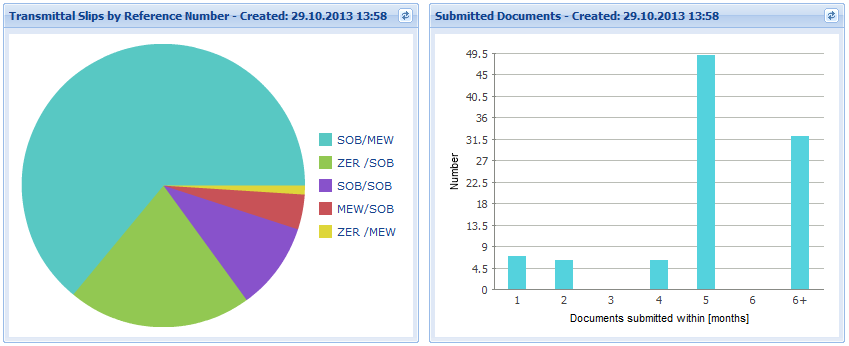
Transmittal Follow Up
The view "Transmittal Follow Up" gives you the opportunity to monitor the submitted documents according to specific time frames or categorized by their respective sender and recipient code combination.
All distributed documents will be displayed in the content grid and while the pie chart shows the number of transmittal slips for each existing reference code combination, the bar chart will display the total number of submitted documents within a specific time frame.
As illustrated by the following images, by default the bar chart will show the time period counting backwards form today in months (4 weeks) represented on the x-axis and the number of documents on the y-axis.
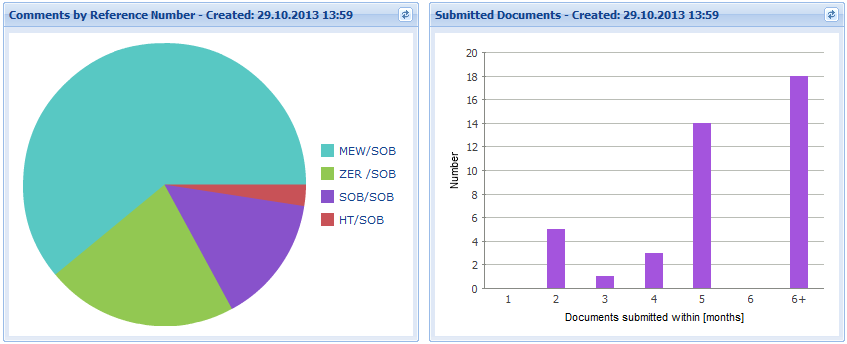
Comment Follow Up
In using the controlling view "Comment Follow Up", you are able to monitor the internal and external comments receive in a specific time frame.
The content grid in the lower part of the view will present you with a table listing all documents that were commented by the customers, the suppliers or by internal sources. The two charts above the table highlight two important information details from which you will be able gain knowledge about the success of your projects.
The chart to the left which presents its data in form of a pie chart, displays the number of comments of each existing sender and recipient code combination. In the exemplary screenshot below the number of all internal comments is pointed out (the indication that those comments are internal comments is suggested by the fact the sender and recipient code is the same). The bar chart positioned on the right hand side of this view, displays the number of comments as well as the number of submitted documents within a specific time frame (e.g. one month / four weeks). In the below illustrated example there were 16 comments sent within a five month time frame.